The anatomy of income tax: revenue, base and distribution
from obolus finanz Team
Who carries the income tax burden? This analysis explains tax segments, revenue concentration and the role of top-income groups.
A frequent claim in tax debates is that only a small high-income group carries a disproportionately large share of financing. A look at wage and income tax statistics supports that the burden is highly concentrated.
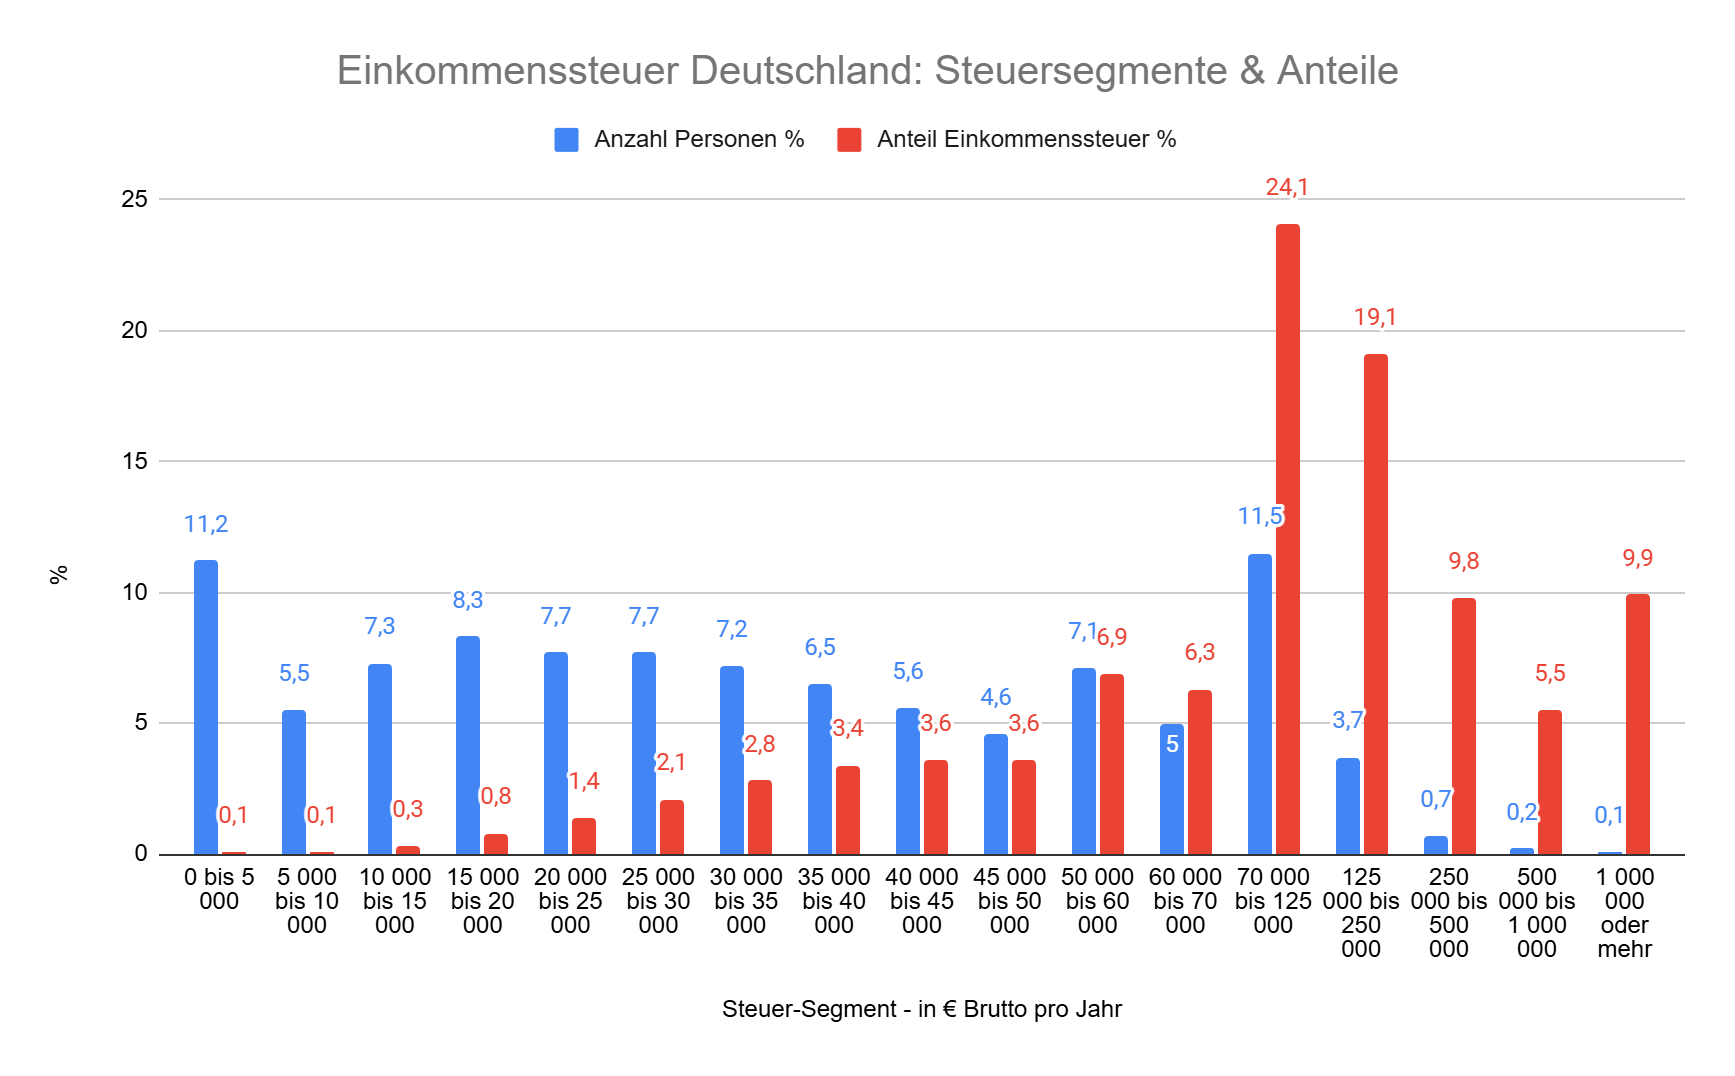
The distribution chart (“tax segments & shares”) highlights the asymmetry:
- Broad base: lower income groups contribute comparatively little income tax because of the basic allowance and progressive entry zones.
- Top segments: burden concentration rises sharply toward the top of the income ladder.
The income-millionaire segment (gross income above €1 million) represents only about 0.1% of taxpayers but contributes roughly 9.9% of total income tax.
Adding the next segment (€500k to €1 million) brings another 0.2% of taxpayers and around 5.5% of revenue.
If the top three segments are combined (roughly incomes above €250k), they represent about 1.0% of taxpayers and contribute around 25.2% of total income tax revenue.
This concentration has two sides:
- It reflects redistribution through a progressive tariff (“strong shoulders carry more”).
- It also creates concentration risk for public budgets if this small tax base weakens cyclically or migrates.